The Hope Street Temporary Trail is complete!
Read our final report:
Please wait while flipbook is loading. For more related info, FAQs and issues please refer to DearFlip WordPress Flipbook Plugin Help documentation.
Please wait while flipbook is loading. For more related info, FAQs and issues please refer to DearFlip WordPress Flipbook Plugin Help documentation.
Final Report PDF and Appendices – note: raw data is available upon request.
Watch the video wrap-up by Jai Communications:
TOP RESULTS:
- During the trial, a total of 2,235 intercept surveys were collected, both online and in person. These surveys revealed that 53% of respondents were in favor of the trail, 43% were opposed, and 4% were unsure.
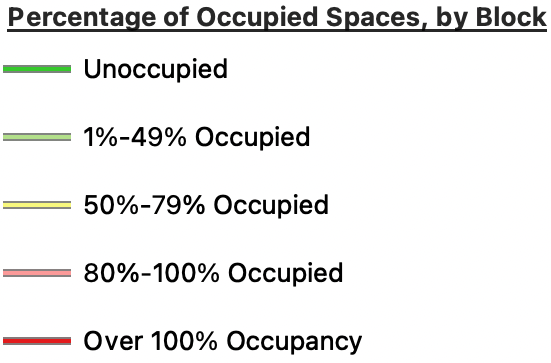
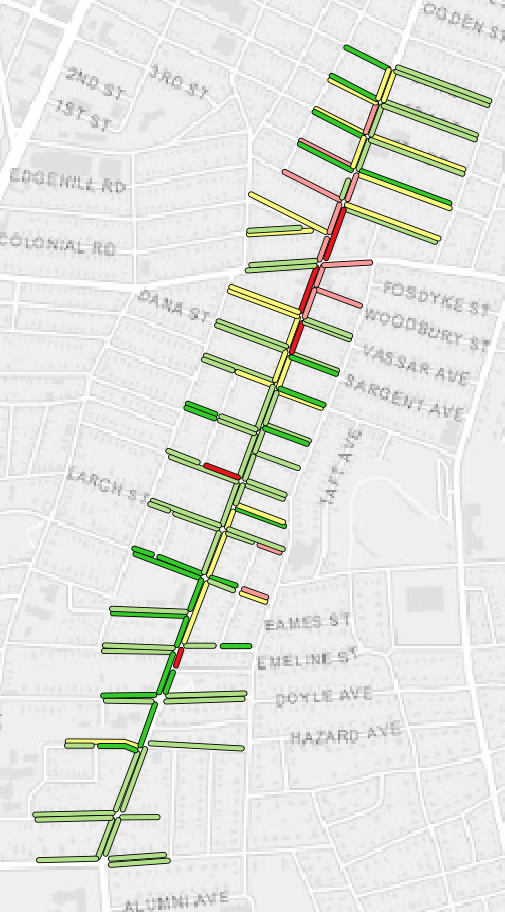
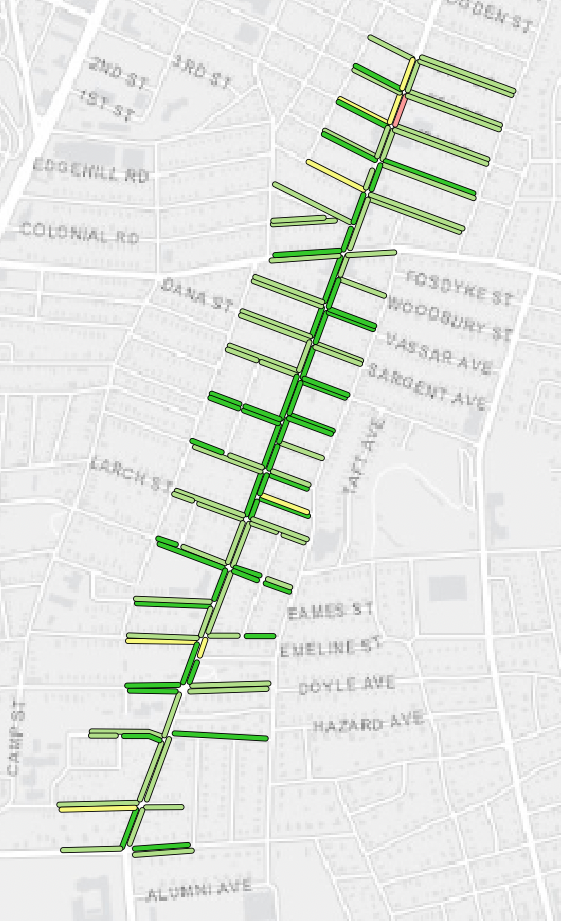
- Quantitative data analysis included a parking occupancy study conducted before and during the trial to determine how much parking is utilized and how the temporary trail could affect residents and businesses. It was found that the trail occupied 132 (9.6%) of a possible 1,233 spaces either on or within one block of Hope Street. For the entire study area, the average parking occupancy rate was 27% pre-trial, and 33% during the trial. In the business district (Dana/Lewis Street to 6th Street), the average occupancy rate was 33% before the trial, and 35% during the trial. The highest occupancy rates in the business district were found on Saturday afternoons, with 47% pre-trial, and 47% during the trial.
- Eco-counters measured the number of bikers and scooters on Hope Street before and during the trial. Bike and scooter rides doubled during the trial, counting a total of 1,800 rides. A survey of trail users (703 responses) found 89% wanted the trail to be permanent, 8% did not want it to be permanent, and 3% were unsure. No crashes occurred during the trial.
- A pedestrian survey of people walking next to the trail collected 452 results with 58% of pedestrians wanting the trail to be permanent, 36% not wanting it to be permanent, and 6% unsure. One of the main sentiments among pedestrians was that they felt safer while walking because the trail provided a barrier between them and drivers, and opened up sight lines for more visible movement.
- Equity, accessibility, and the health of the local economy was a top concern among both trail supporters and opponents.
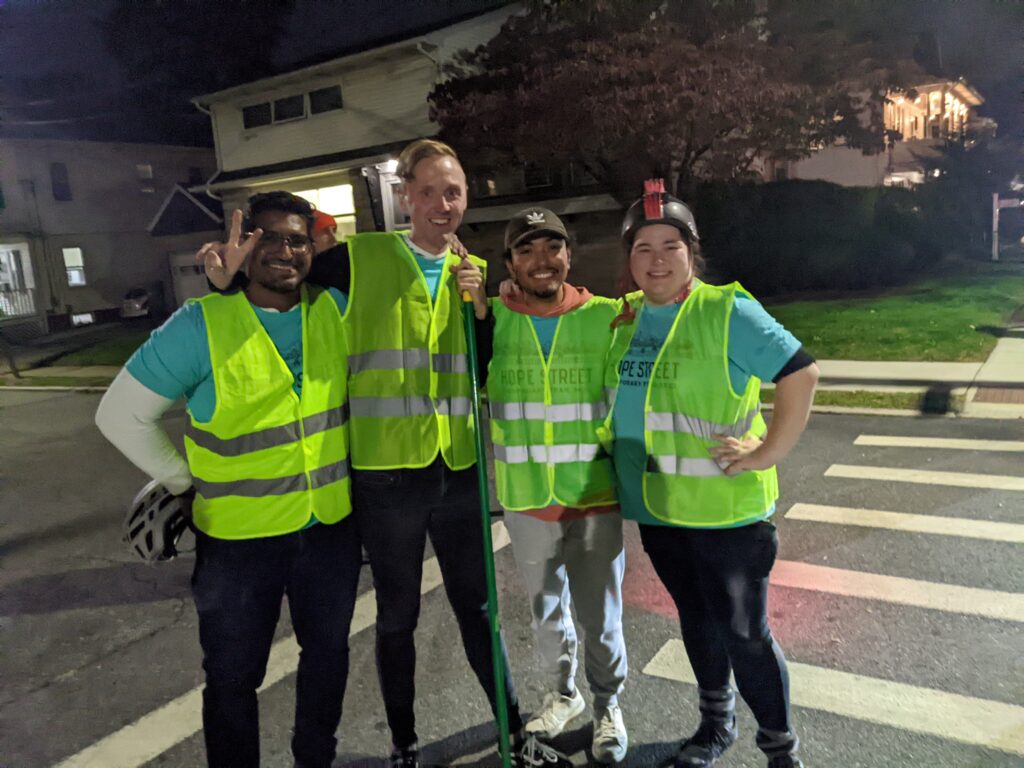
THANK YOU to all of our incredible volunteers, sponsors, partners, and the whole neighborhood for coming out to experience the Hope Street Temporary Trail!
Read news coverage of the trail:
Providence Streets Coalition to begin report on temporary bike path project feedback (NBC10)
Hope Street’s temporary bike lane met with cheers — and jeers (Boston Globe)
- Pilot bike path on Hope Street draws mixed reactions (Brown Daily Herald)
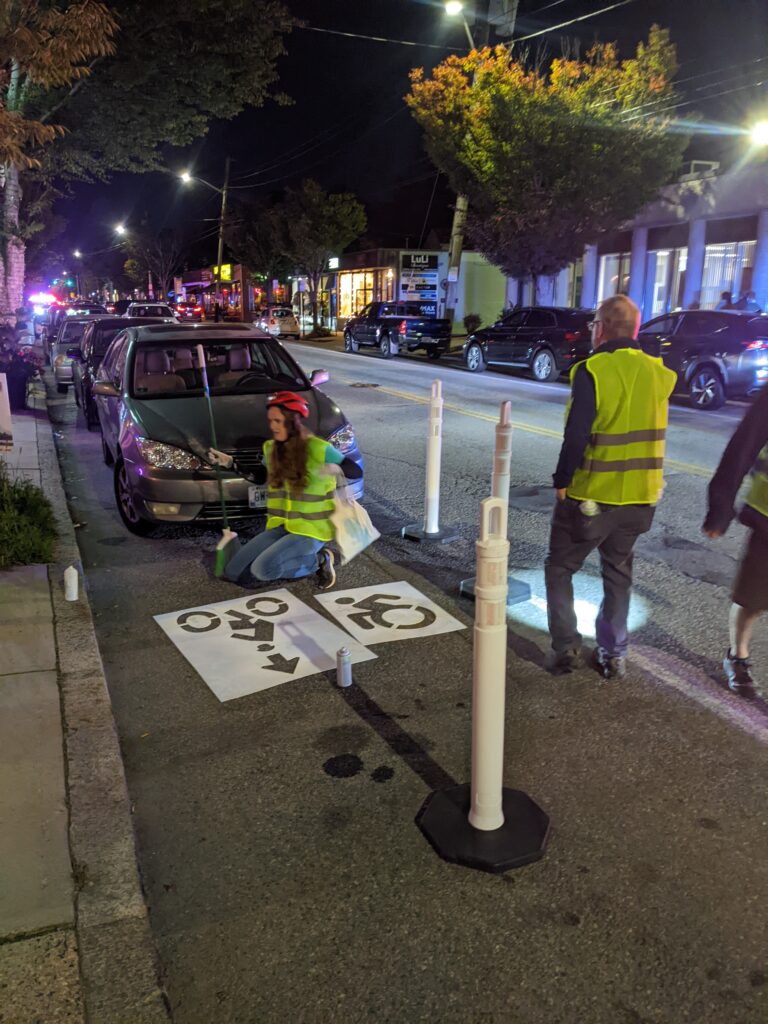
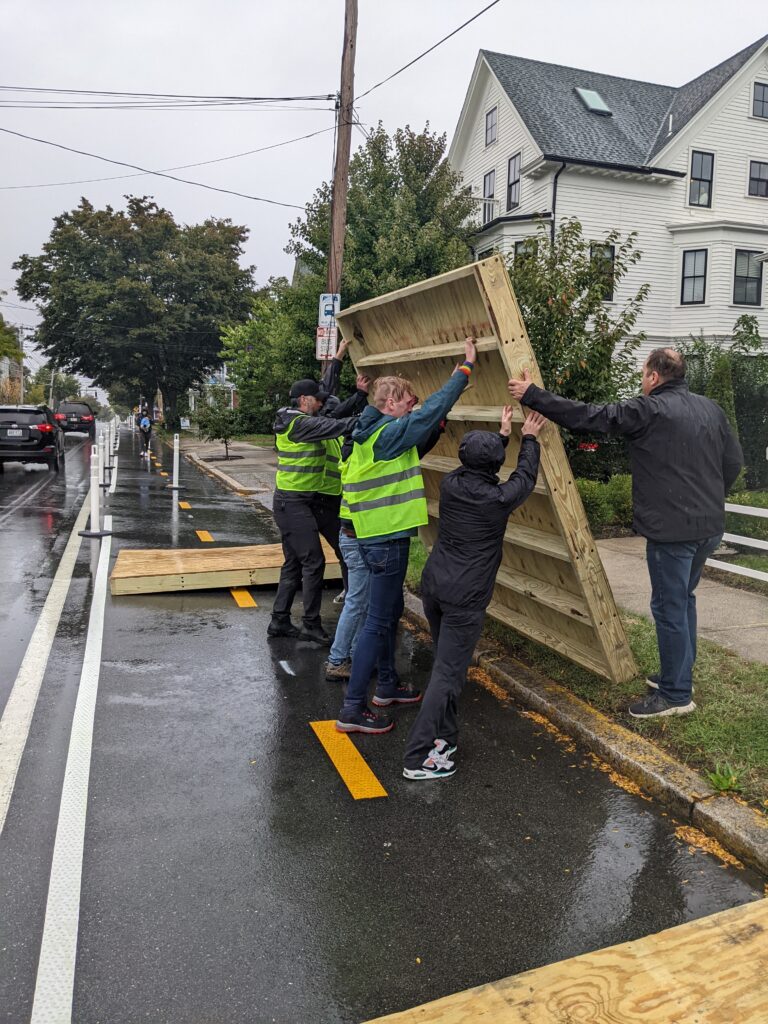
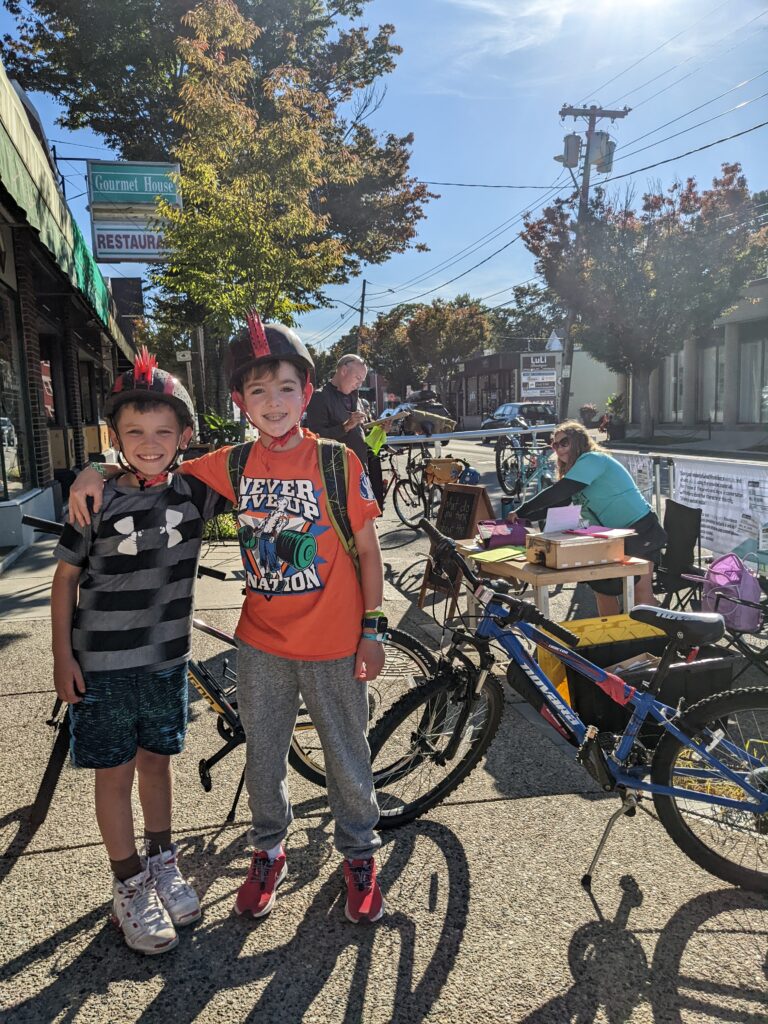
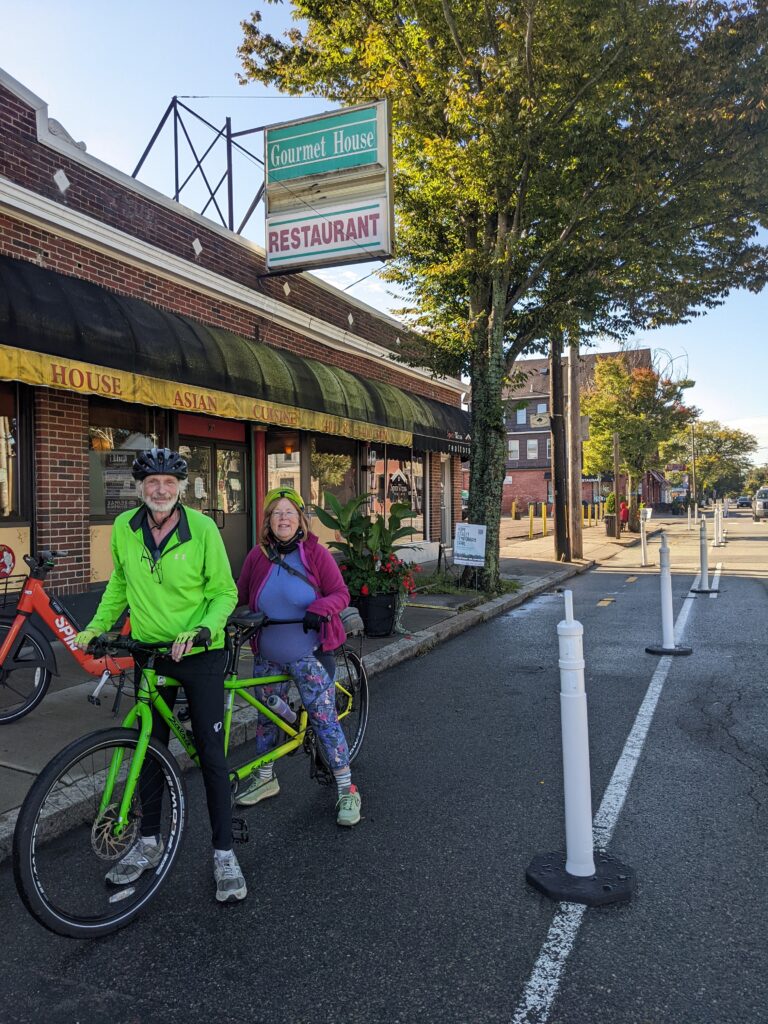
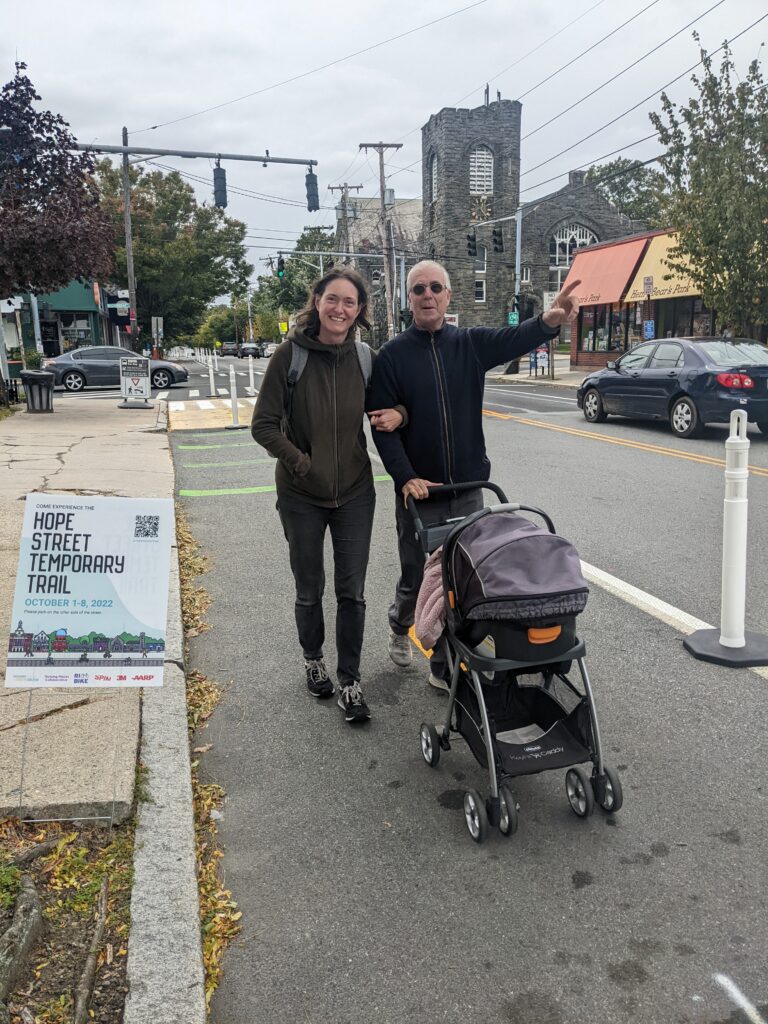
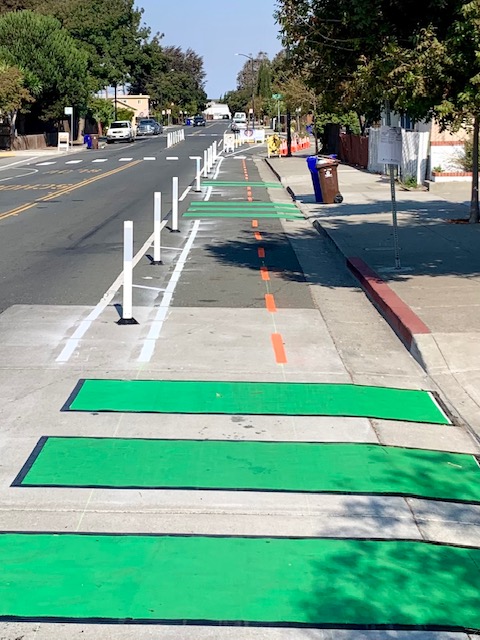
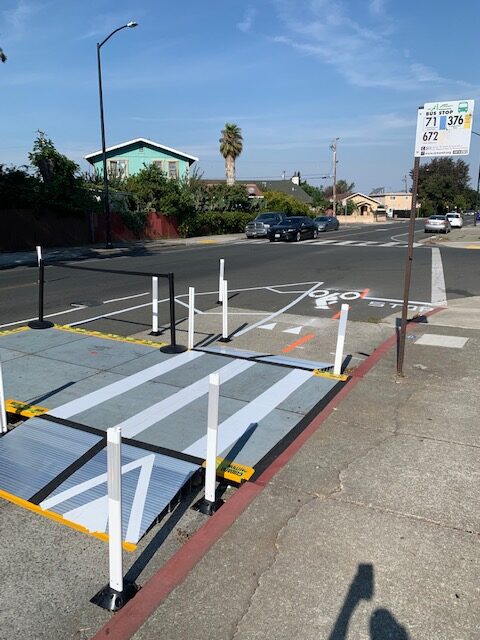
Enjoy some of our favorite photos:
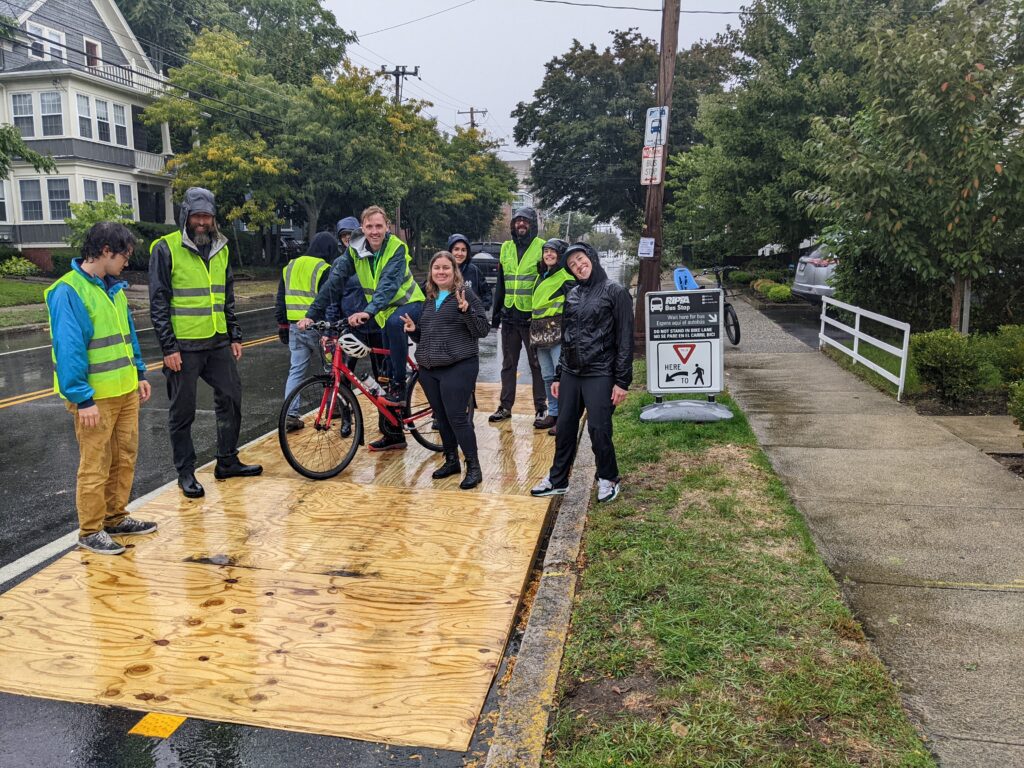
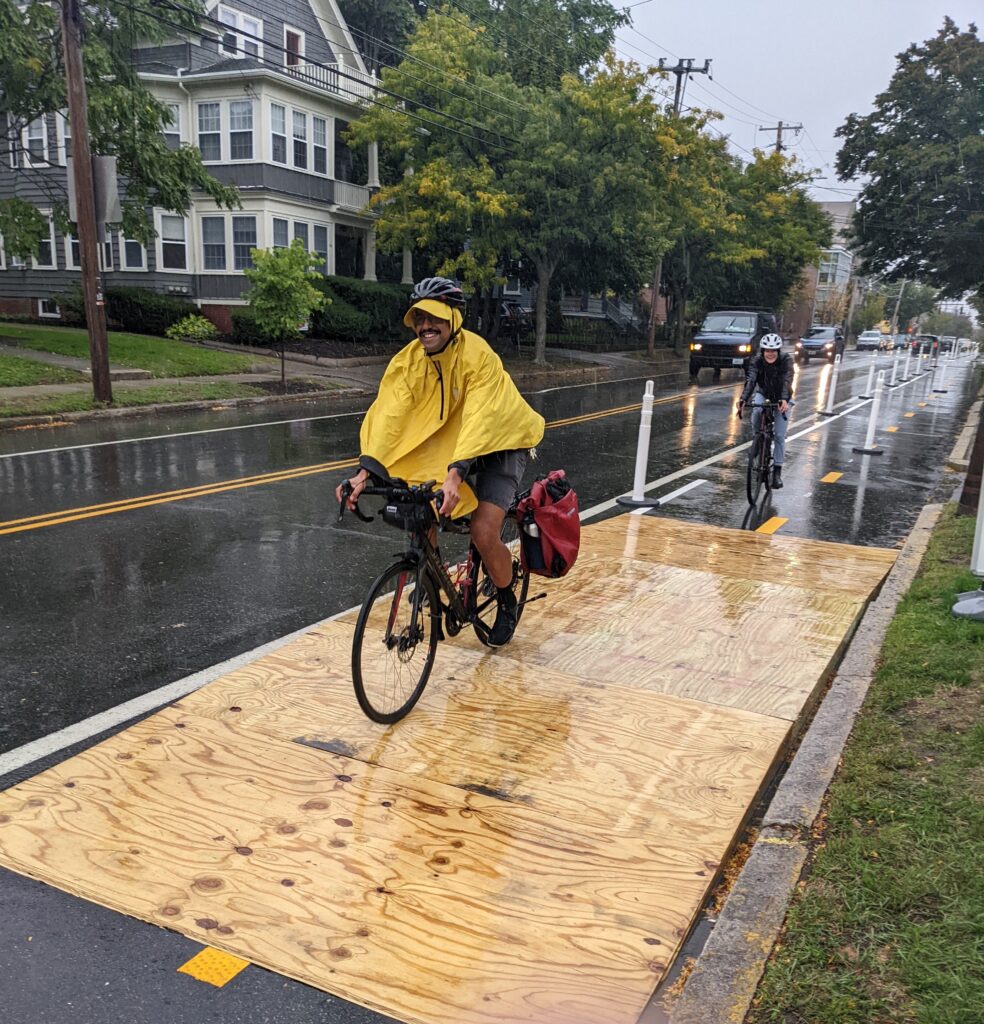
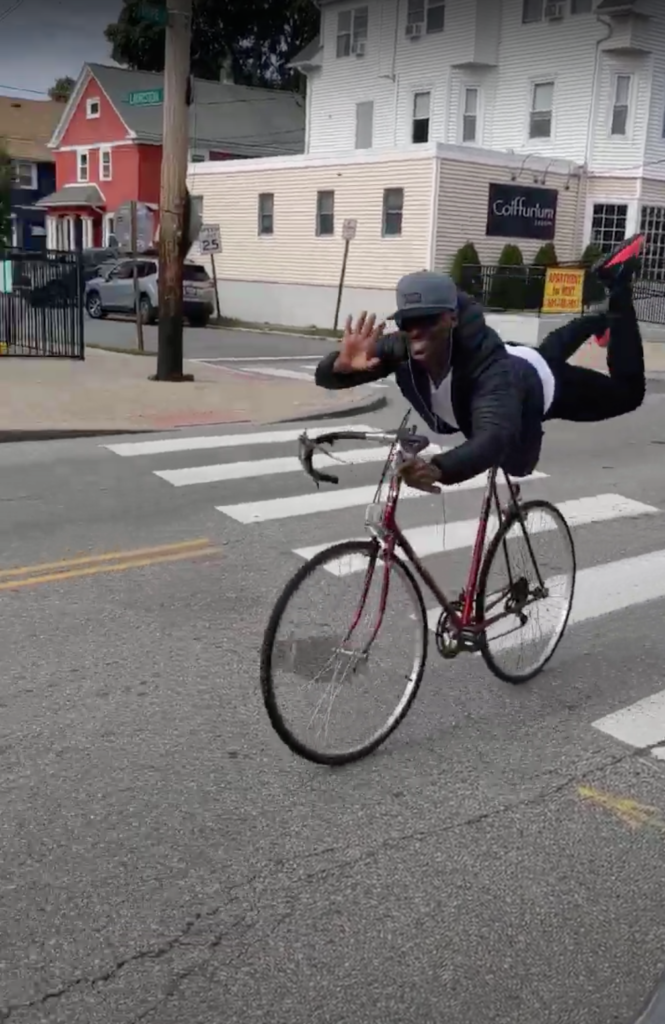
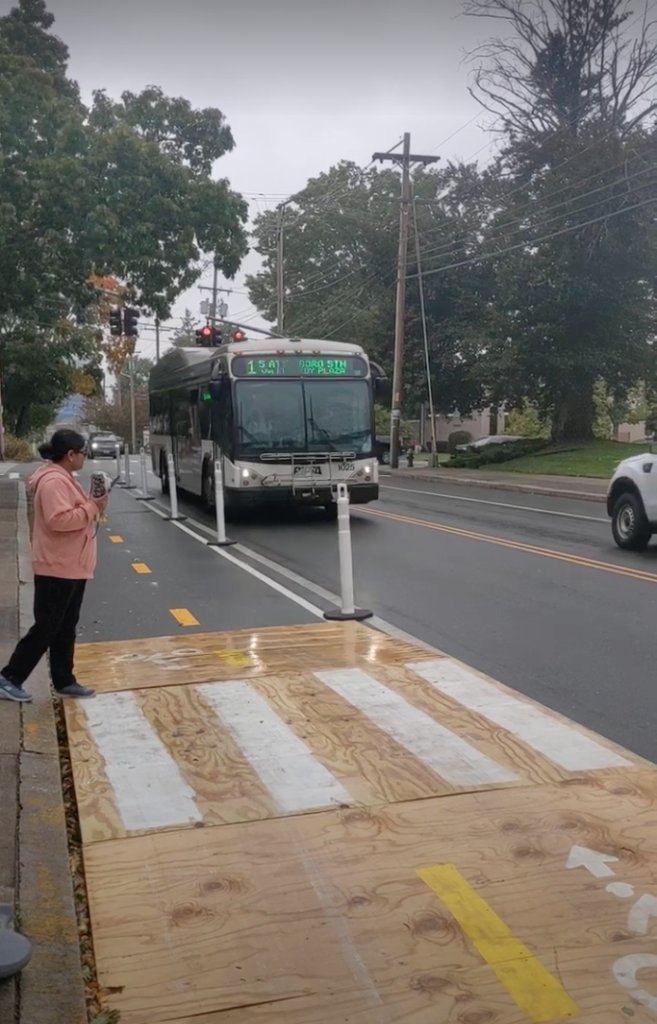
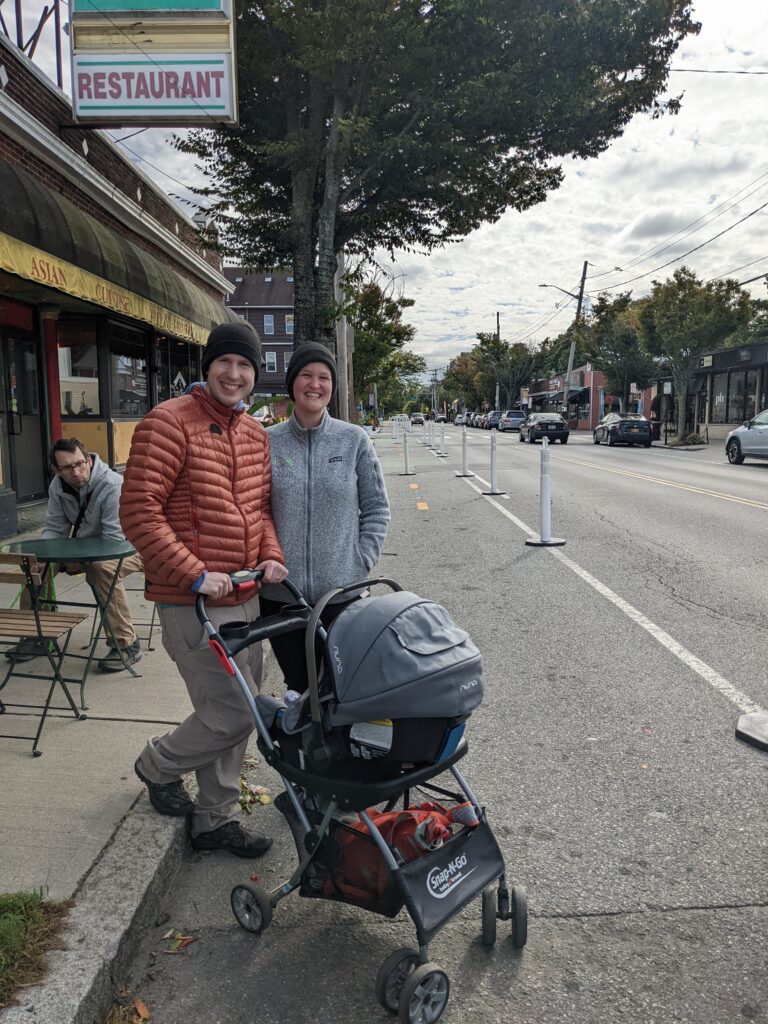
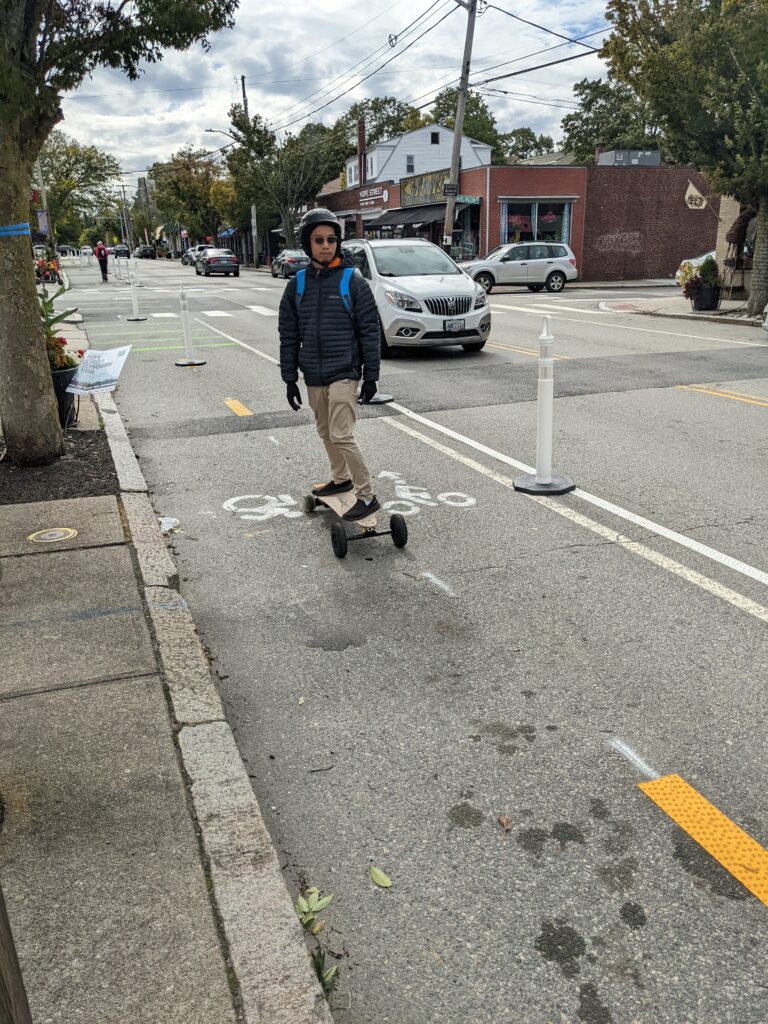
October 1st-8th 2022, we tested something new!
The Providence Streets Coalition, Thriving Places Collaborative, Rhode Island Bicycle Coalition, SPIN Streets, AARP , and 3M Gives are working with local partners, residents, and businesses to test a temporary urban trail on Hope Street in Providence this fall, as called for in the City of Providence’s Great Streets Plan.
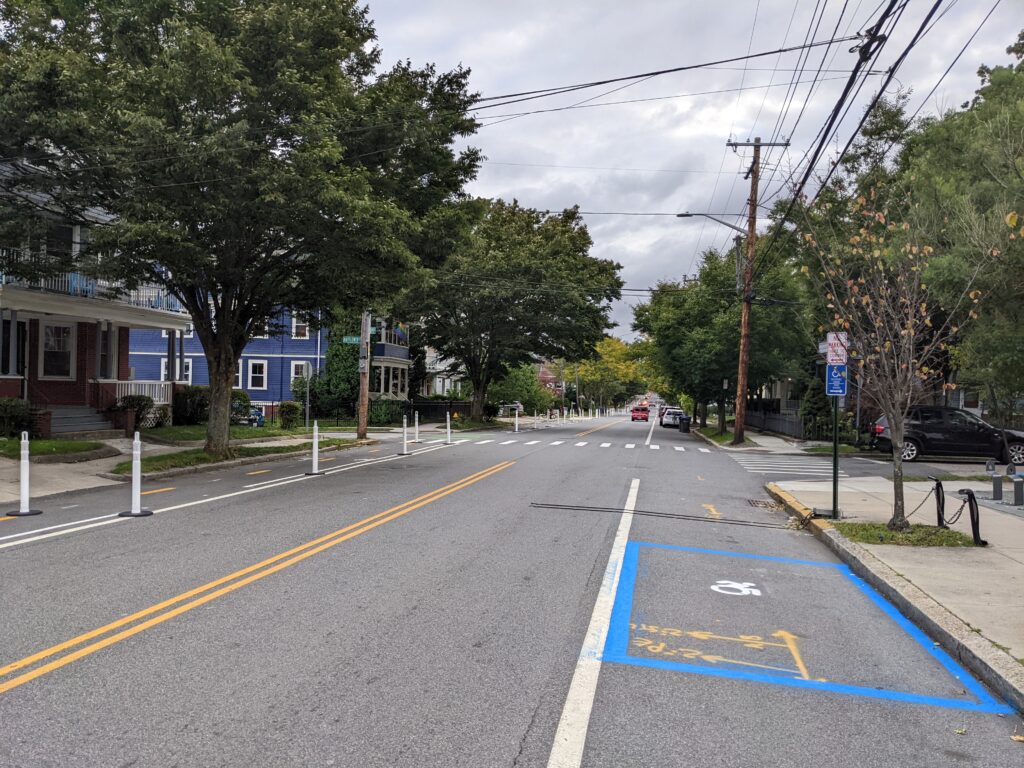
The Hope Street Temporary Trail is a community-led effort that will consolidate parking to the west side of Hope Street and create a one-mile trail for walking, jogging, rolling, and biking on the east side from Lauriston Street to Olney Street (Frog & Toad to Tortilla Flats). The temporary trail will be in place for one week*, and give residents and business owners a chance to experience this potential change in 3D, interact with it, and give their informed feedback.
SIGN UP TO VOLUNTEER!
UPDATES (9/19):
- Our in-business survey is live now through the end of the trial (October 8th). Please take the survey when you shop or dine on Hope Street!
- Our final pre-trial community meeting will be on Thursday, September 22nd at 6pm at the Rochambeau Library, 708 Hope Street. Join us in person or on Zoom: https://us06web.zoom.us/j/82506411555
- Join us for an outdoor movie night on Thursday, October 6th at Festival Ballet. We’ll be hosting a free screening of THE STREET PROJECT, a new documentary on the global movement for safer streets. RSVP here.

During the installation, we will assess safety, parking and business impacts, and collect community feedback that will help inform potential future designs. The data collected before, during, and after the demonstration will help local community groups and the City of Providence as they plan future street interventions for safer, more sustainable, and more inclusive mobility. We want to know what YOU would like to see happen as part of this temporary trail experiment!
Timeline:
- Fall 2021: Public meeting held with Councilwoman LaFortune
- Fall 2021: Community surveys and parking study collected
- Fall 2021-Summer 2022: Business and resident direct engagement
- Winter/Spring 2022: Funding applications
- Spring 2022-Summer 2022: Physical planning: engineering drawings, logistics, procurement, volunteer recruitment
- October 2022: Installation
- December 2022: Final report and community meetings
*At this time, the City has no funding or timeline to implement a permanent trail or other street design changes. Click here for an example of a temporary trail on Broad Street.
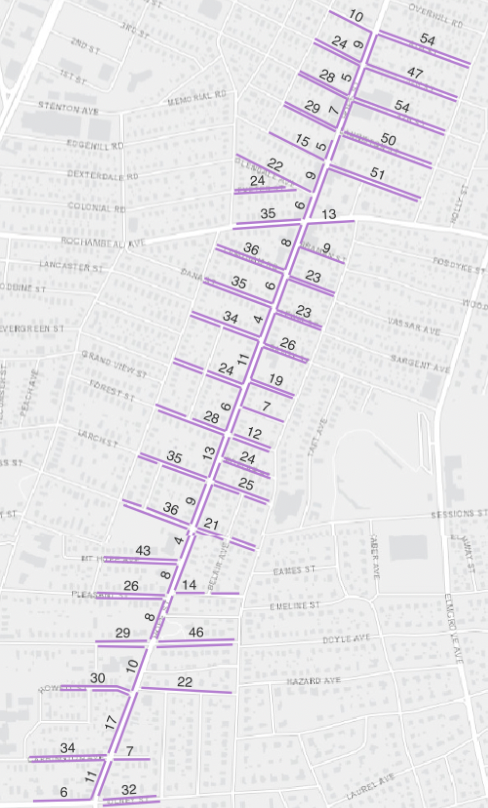
Pre-Demonstration Parking Study: Summary of Findings
- We counted parking availability and occupancy on Hope Street from Olney to 4th Street and one block to the east and west
- 30 volunteers collected occupancy on a Saturday, Sunday, Monday, and Tuesday Counted 4x / day, each block counted 16 times
- 132 Parking Spaces are located on the east side of Hope Street, which represents 9% of total parking spaces in the area
- The average occupancy rate is 24%, meaning 76% of parking spaces are open for parking
- The highest occupancy rate at the busiest time (Saturday afternoon) is 35%, and there are 452 vacant spaces
- In the northern section of Hope Street, there is an occupancy rate of 46%, with 322 vacant spaces
- The lowest occupancy rate at the least busy time (Monday afternoon) is 15%, with 1164 vacant spaces
The highest occupancy rates in the north section (i.e. business district) of the parking study area occurred on Saturday afternoon and Saturday night, when 45.48% and 35.34% of spaces were occupied. However, even during these busiest times, ample parking is available on the side streets in the area. On Saturday afternoon, there were 386 vacant spaces available in this section and on Saturday night, there were 558 vacant spaces.
The highest occupancy rates in the south section (i.e. residential district) of the parking study area occurred on Monday morning and Sunday midday, when 26.02% and 24.03% of spaces were occupied. We are aware that Sunday midday is a time when many churches in the area have services, and we will be working with them to assure that parking is as accessible as possible during that time. On Monday morning, there were 435 vacant spaces available in this section and on Sunday midday, there were 443 vacant spaces.
Pre-Demonstration Community Survey: Summary of Findings
- We conducted an online survey, November-December, 2021 and received 496 responses
- 55.4% of respondents either live on Hope Street or within 2 blocks, another 25.4% live within a quarter mile.
- 16 business owners responded, 10 do not support a permanent trail
- 63.8% of respondents expressed support for an urban trail on Hope St.
- 63.5% of respondents say they would be more likely to ride on Hope St. with a safer trail
- 48.9% of respondents who currently ride a bike on Hope St. have safety concerns
- Top concerns: parking; safety for drivers, cyclists, pedestrians; impacts on business
Community feedback
“While biking home I took the lane, impatient driver behind me couldn’t wait and pushed me into adjacent parked cars (near Frog and Toad) and screamed at me. Many other similar incidents without physical contact.”
“More space between those walking and those dining outdoors! pushing a stroller down the sidewalks is a nightmare!”
“I’m worried that trying this for just a few days will bring all the anger and confusion from drivers without the time to adjust and appreciate the benefits. Recommend lots of “this is an experiment” signage!”
“I am excited for this project! Hope St is such an important connection for cyclists but it is only for the fearless that are willing to contend with impatient drivers.”
“While parallel parking, a passing car hit me as I was adjusting the car into the spot. Was technically my fault but another factor is that Hope Street becomes very narrow where cars are parked on both sides.”
“It is just very congested, and very trying, with all the side street intersections.”
Next Steps:
- July & August:
- Full canvass #1
- Design and deliver business survey
- Install counter to start collecting user data
- Community meetings and BBQs: Friends of Rochambeau, YMCA, Mount Hope Community Center, faith institutions, school PTOs
- Order materials
- September:
- Full canvass #2 right before installation
- Event planning – movie night, Bike & Walk to School Day, Providence Bike Jam
- Volunteer coordination
- Installation plan
- October: install!
- Data collection:
- In-business surveys
- Intercept feedback
- Trail user surveys
- Counters
- Data collection:
- November & December:
- Post-installation community survey
- Data analysis
- Report writing
- Final community meetings
Studies on Active Mobility Infrastructure in Business Districts:
There is an abundance of evidence around the globe that shows how good active mobility infrastructure is for businesses and city life at large. Poirier’s 2018 study in Transportation Research acknowledges that merchants often object to bike lanes for fear of loss of potential business because they are unaware of the data. But Poirier found that bicycle lanes in a dense city like Providence “rarely produce profoundly negative outcomes,” and “that they are often associated with positive business performance outcomes.” Poirier also adds that cycling brings societal benefits such as “positive public health outcomes, reduced pollution, lower cost to travelers, and reduced demand on road space, freeing right-of-way for alternative uses.”
- 63% of people say Providence should have more protected bike lanes that are separated from driving lanes, even if it means reducing driving lanes and less on-street parking, up from 58% in 2019
- 64% of people say they are more likely to support a business that demonstrates a commitment to non-car transportation solutions
- 80% of people believe that developing alternatives to driving is the best way to reduce our city’s traffic issues, up from 77% in 2019.
- 71% believe that better transportation options, like public buses and safe biking, makes it easier to get to work on time
- 70% would like to ride a bicycle more often, up from 58% in 2019.
CONTACT:
Liza Burkin, Lead Organizer, Providence Streets Coalition. liza@ourstreetspvd.org, 401-400-1382